|
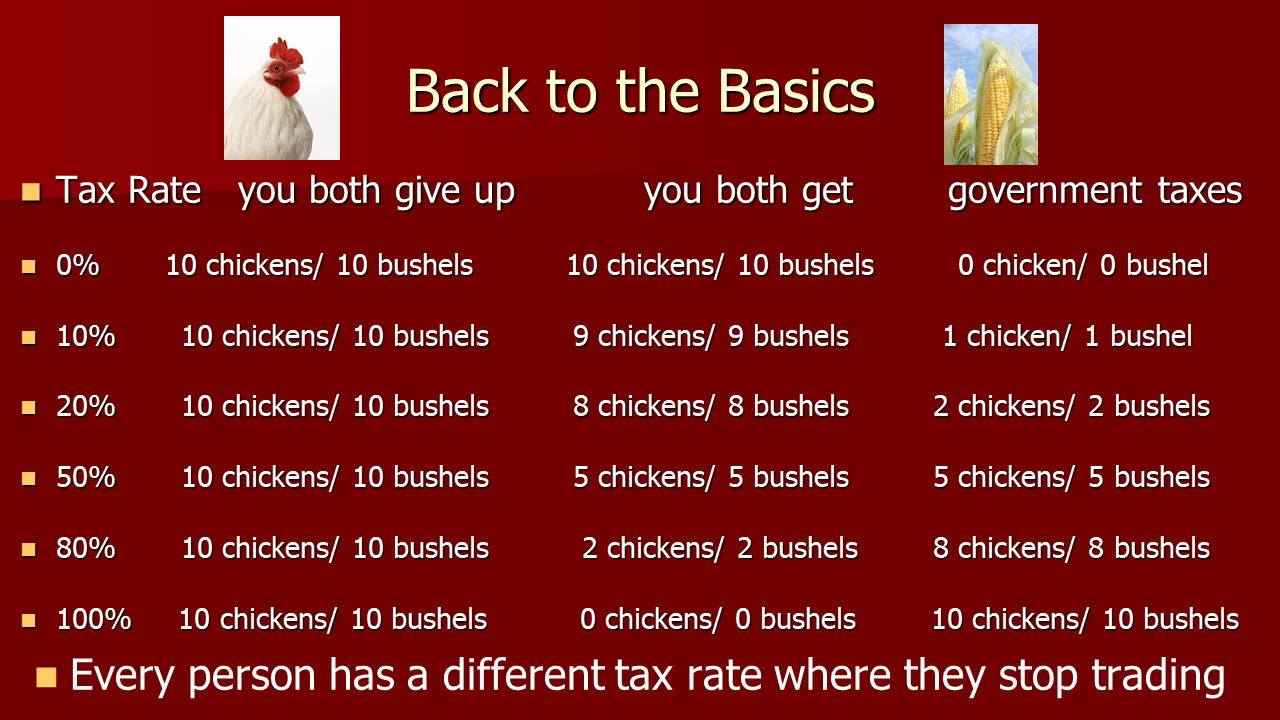
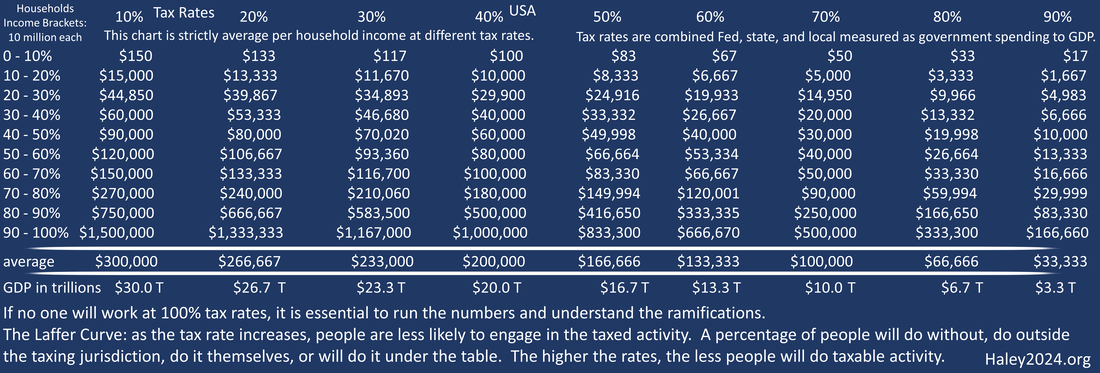
If no one will work at 100% tax rates, it is essential to run the numbers and understand the ramifications.
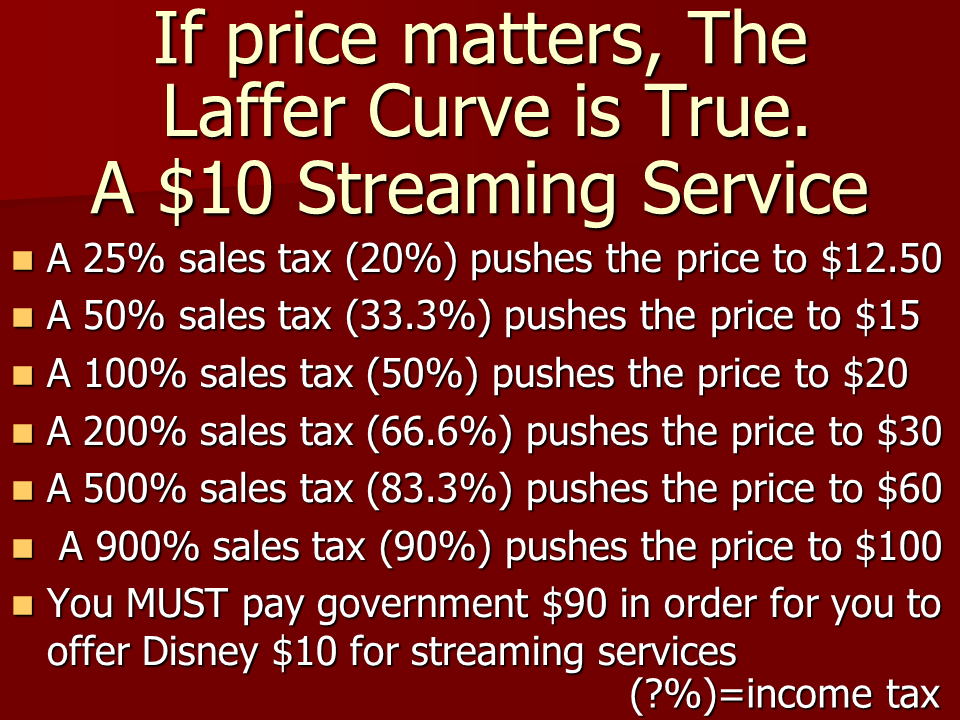
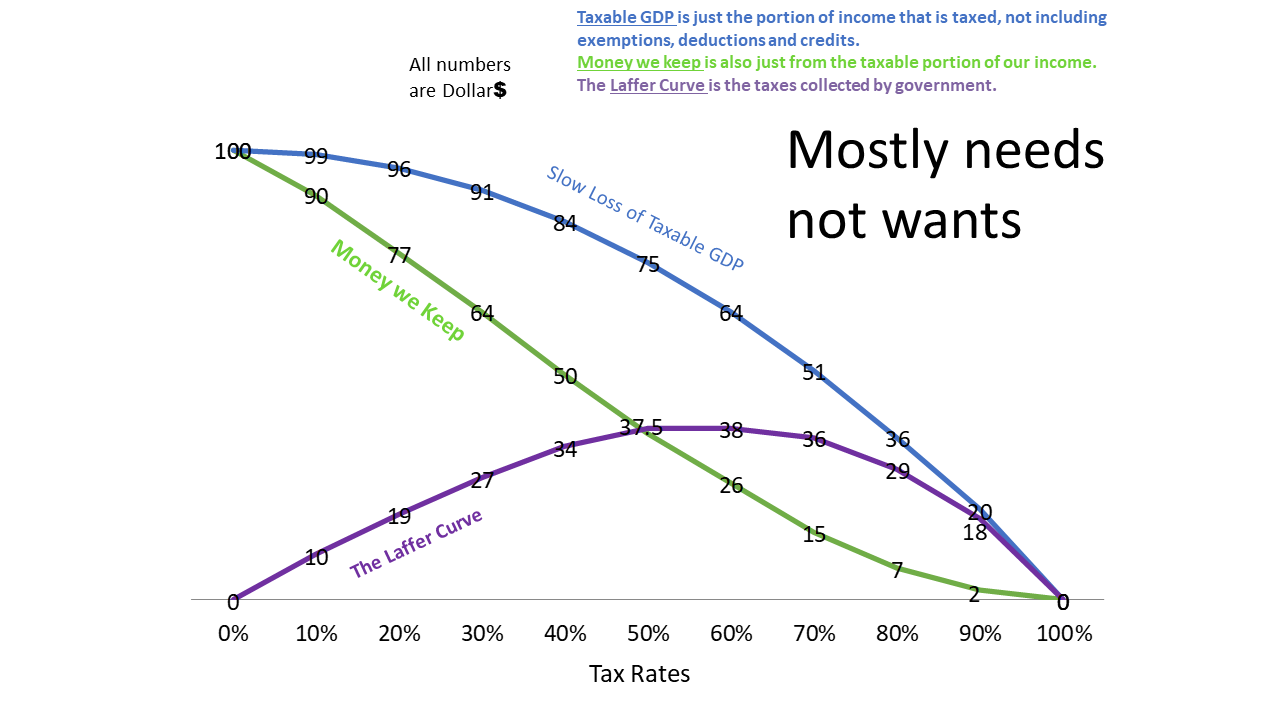
The Laffer Curve: as the tax rate increases, people are less likely to engage in the taxed activity. A percentage of people will do without, do outside the taxing jurisdiction, do it themselves, or will do it under the table. The higher the rates, the less people will do taxable activity. |
|
|
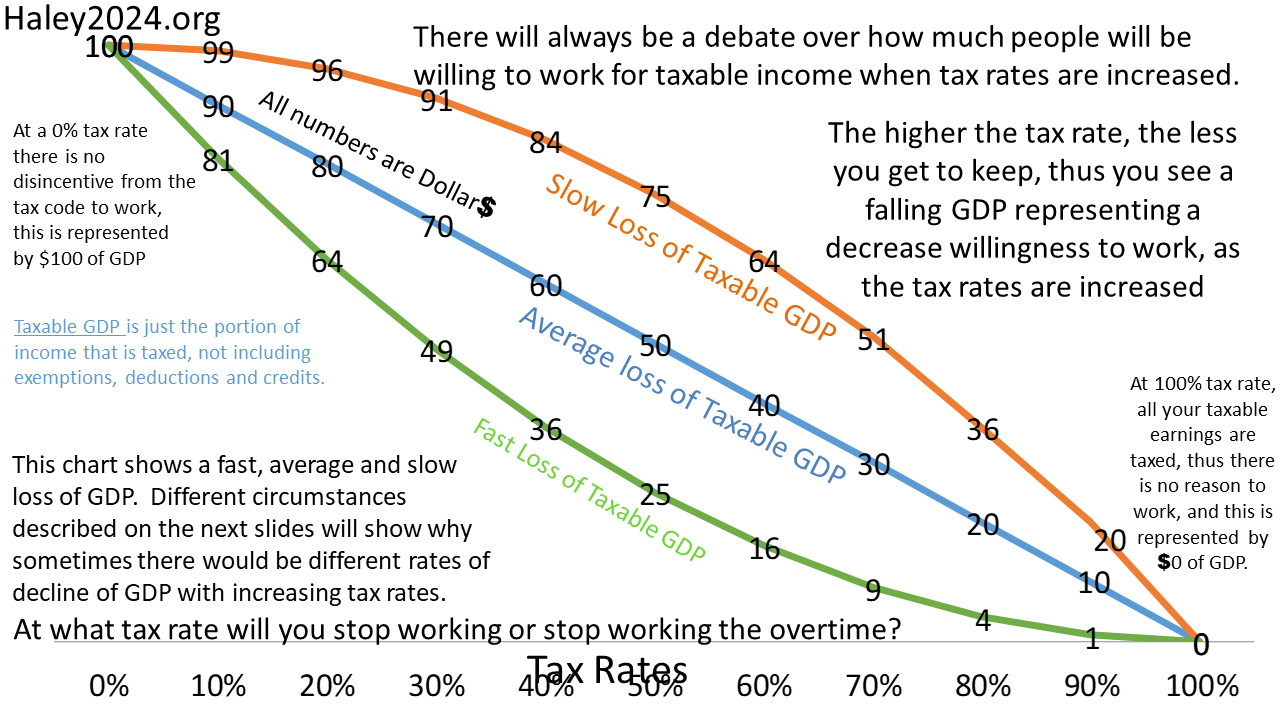
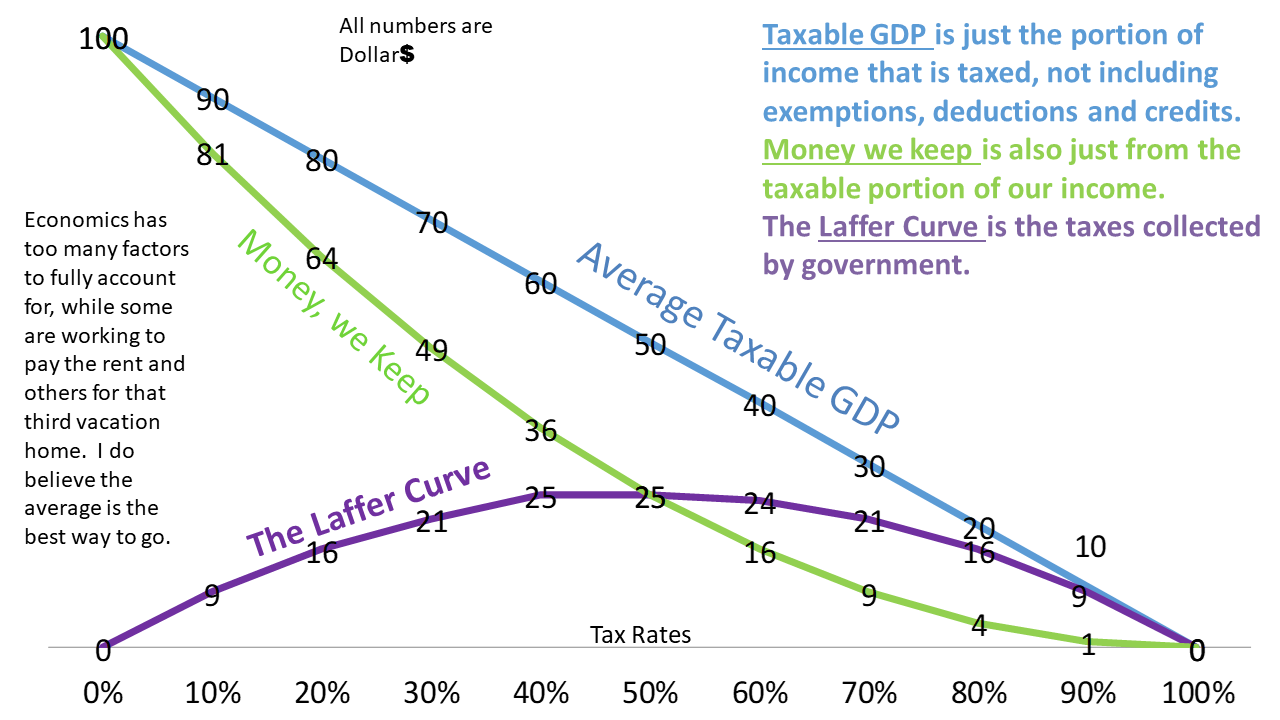
Economics is not a precise science as trillions of factors by billions of people come into play. While the results need to reach $0 of taxable activity at 100% tax rates, the pathway has a range. It is essential to realize that wherever you are on the chart, it is the total economy. Total federal, state, and local government spending to GDP is the best method to determine the tax rate.
|
|
These charts use the average loss of GDP line, meaning the loss of 1% of GDP for every percentage of government spending compared to GDP. I used $20 trillion of GDP at a 40% tax rate. Real numbers are significantly messy with 2020 and 2021 stimulus bills, Covid lockdowns, massive debt, and inflation. It is an economic truth that taxable economic activity will decrease an average of $330 billion for every percent of GDP the government spends. The median earning household would lose $1,000 of gross income for every percent of GDP the government spends
|
|
|
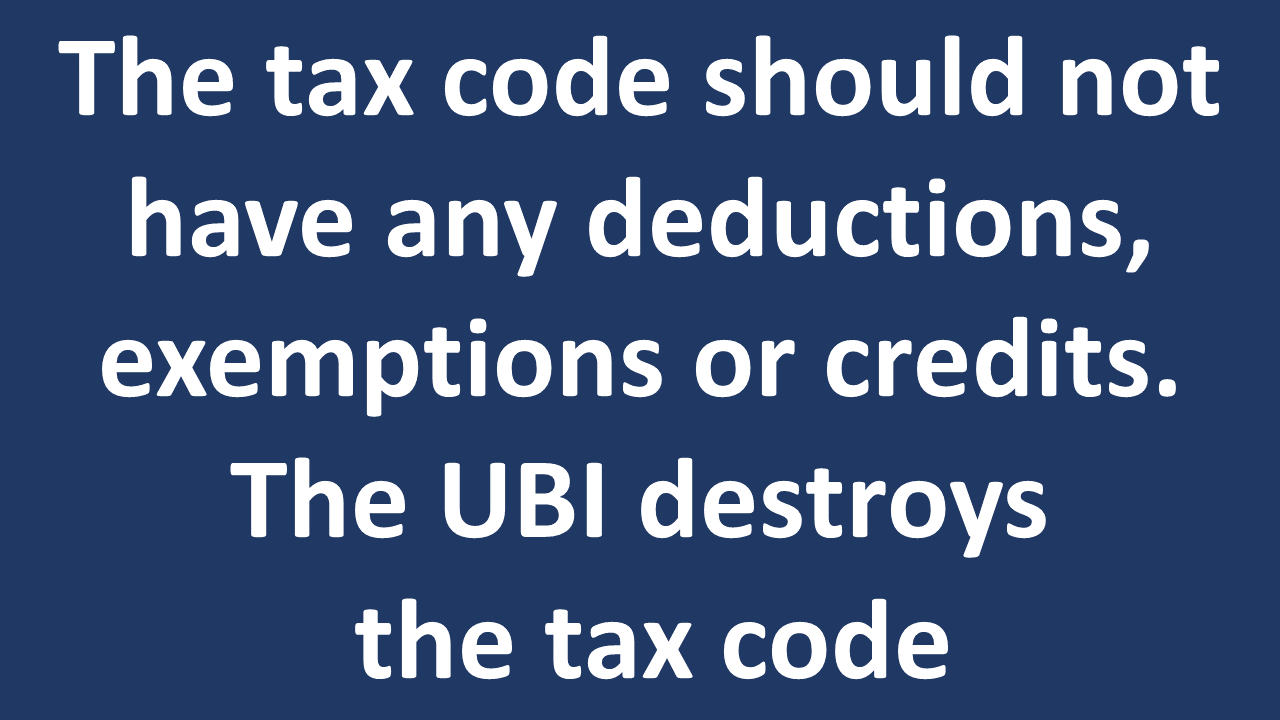
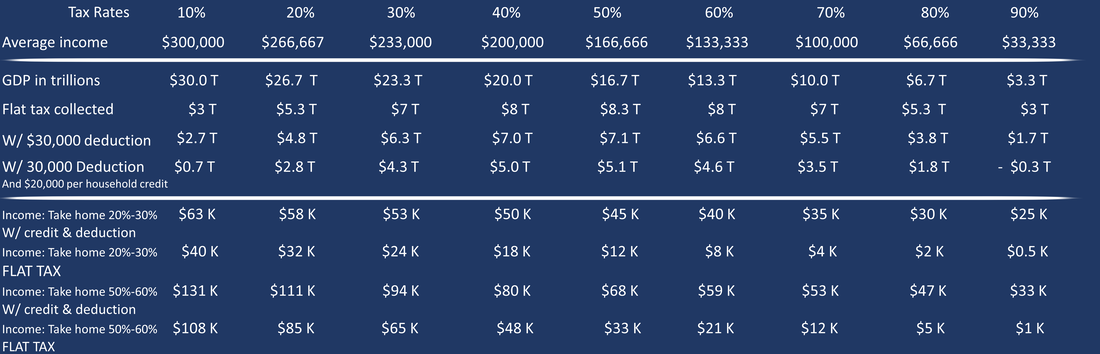
Some conservatives claim that tax credits or income exempted from taxes are just citizens paying fewer taxes. It is the same as government spending; however, just using the tax code. If citizens determine that we should pay for government services as a percentage of our incomes, then all tax cuts need to be by rate reductions. If the government collects $10 and credits $2, it has $8 for government services. This is the same as the government collecting $10 and spending $2 on a UBI and having the same $8 on government services.
|
|
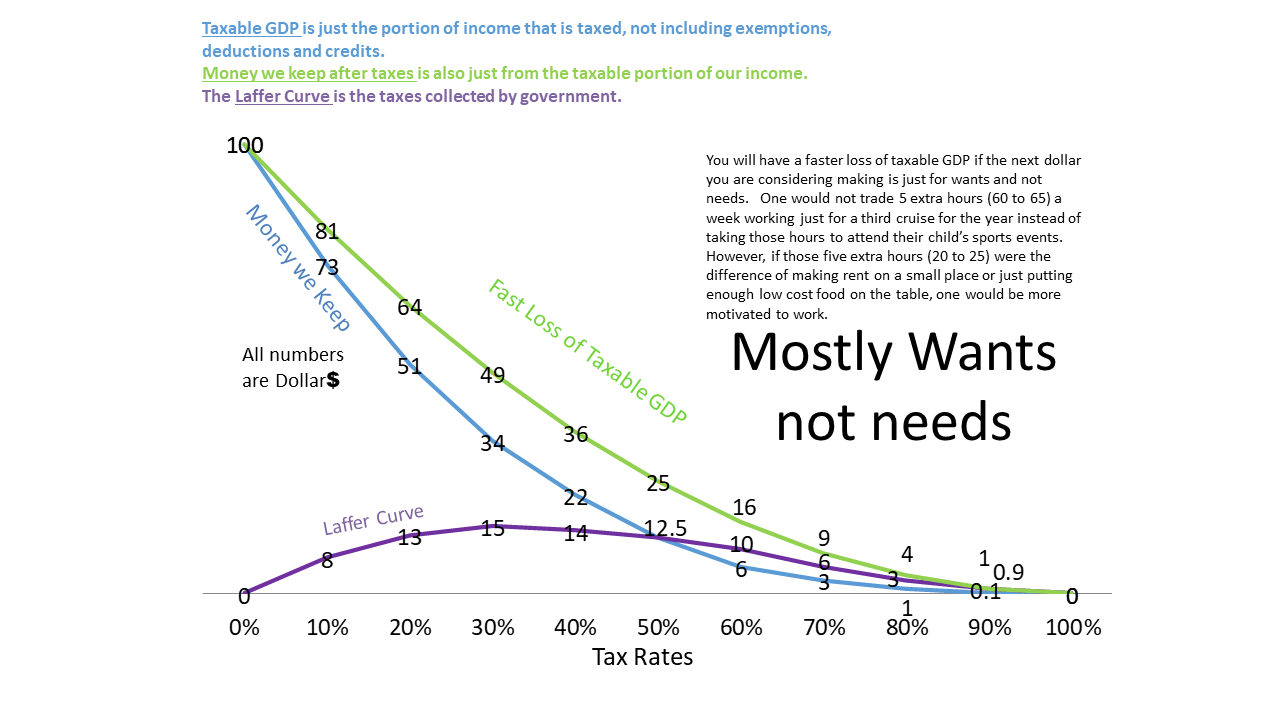
The ‘B” in UBI stands for basic, meaning taking care of the basic necessity of life. Therefore, earning an income would be motivated by wants and not needs. The income in the charts in this blog would decrease much more rapidly as tax rates increase.
GDP does not change overnight. A 5% growth rate/year for 5 years compared to a 1% is a 20% GDP difference. Inflation and other factors keep all the numbers messy! |
|
|
|
Suppose that a company employed 100 people at $40 an hour and at 30 hours a week. The company gained additional business and asked everyone for more hours. Every employee would evaluate whether working extra hours was worth the hassle of work and fewer leisure hours. Income after taxes would be a considerable factor. A 25% tax rate means a $30 take-home per hour. A 50% tax rate indicates a $20 take-home per hour. A 75% tax rate means a $10 take-home per hour. A 99% tax rate means a $0.40 take-home per hour. No one would work extra hours if they did not receive additional after-tax income. On average, one employee will decline extra hours per 1% increase in tax rates.
|
|
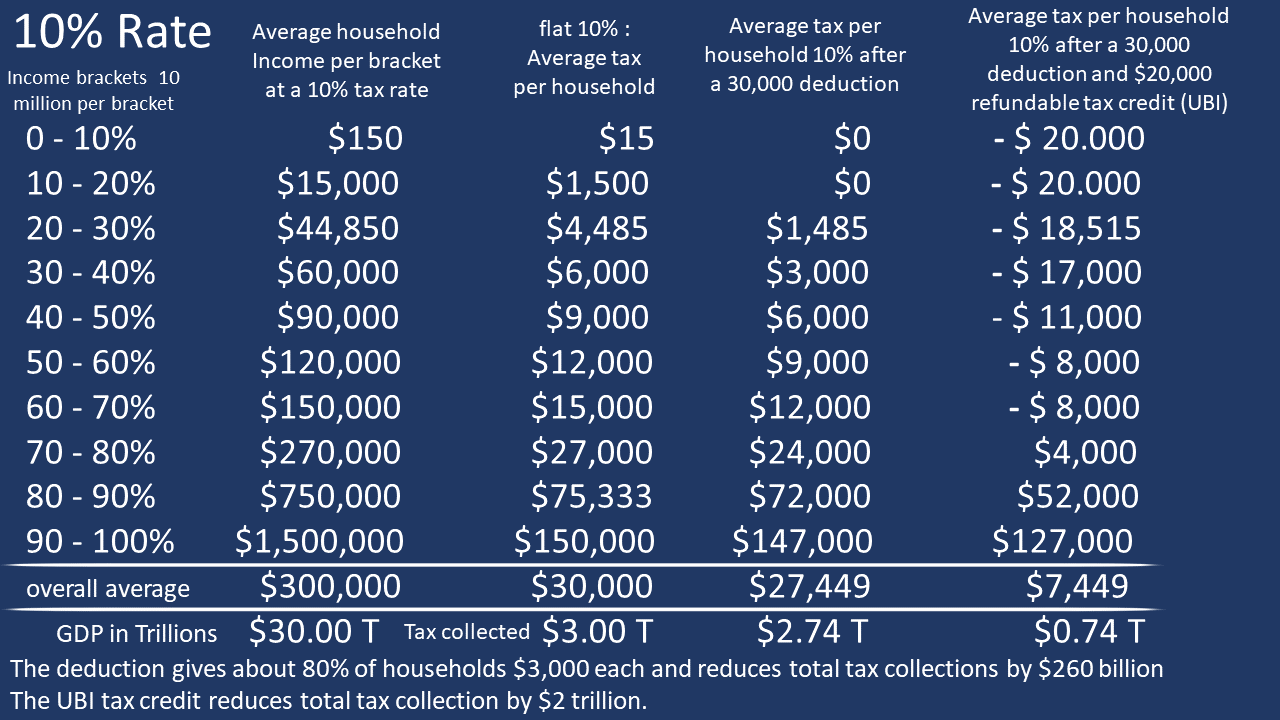
10% might be the lowest spending to GDP that a society can achieve. Roughly 5% for national defense and about 5% for the rule of law. This will require that the citizens take care of helping the poor through charity and achieve private education. Citizens would be required to save for their own retirement and move to private roads.
As the chart clearly shows, the $30,000 deduction reduces tax collections by $260 billion, and the tax credit leaves the government only $740 billion or 2.5% of GDP for the military and the rule of law. |
|
|
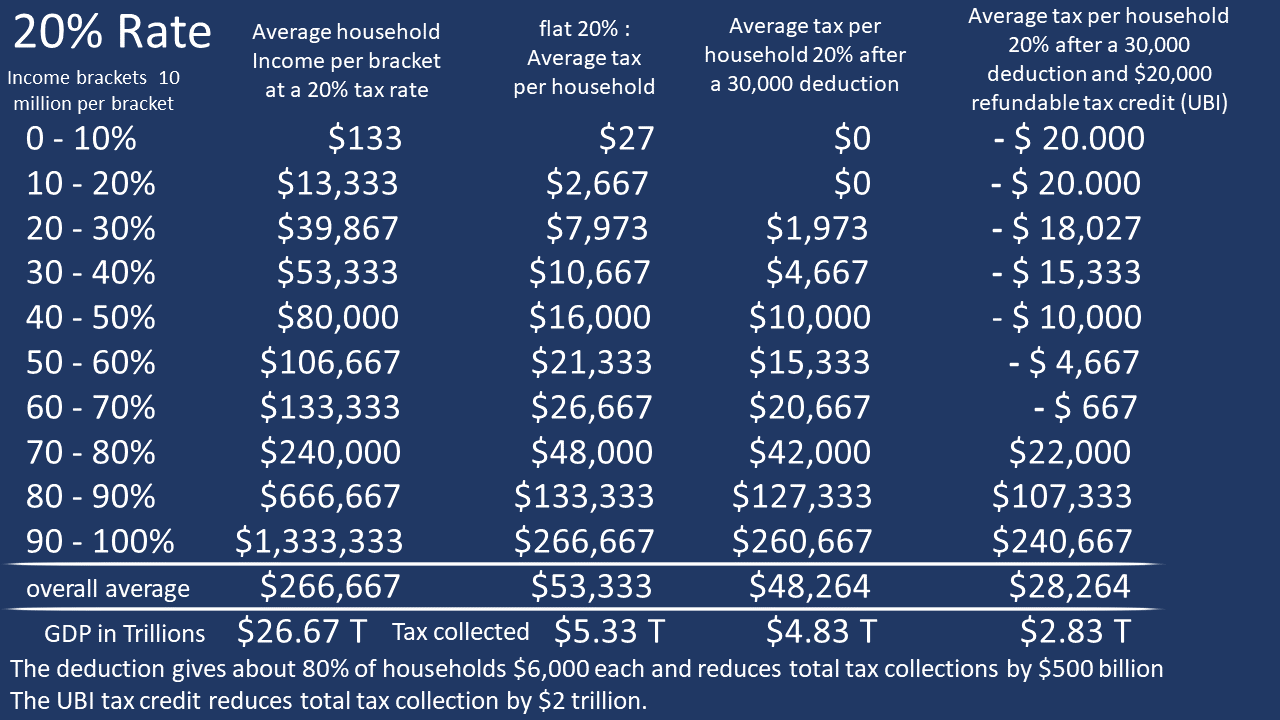
Increasing tax rates from 10% to 20% losses $3.33 trillion in GDP. Household take-home income loses that $3.33 trillion plus $2.3 trillion in additional taxes. The government achieves $5.33 trillion compared to $3 Trillion at a flat 10% tax rate. That additional $2.33 trillion came at a high cost.
The $30,000 deduction costs $500 billion, and the tax credit costs $2 trillion. That $2.5 trillion loss brings total tax collection down to $2.83 trillion, which is lower than the 10% flat tax. |
|
Increasing tax rates from 20% to 30% losses $3.33 trillion in GDP or $6.6 trillion from the 10% tax rate chart. The government does gain $1.66 trillion in additional tax revenue from the 20% chart and $4 trillion from the 10% chart. That is a heavy price just to achieve additional government control.
The flat tax achieves $7 trillion. The $30,000 deduction costs $750 billion, and the tax credit costs $2 trillion, leaving $4.25 trillion for government services. |

|
|
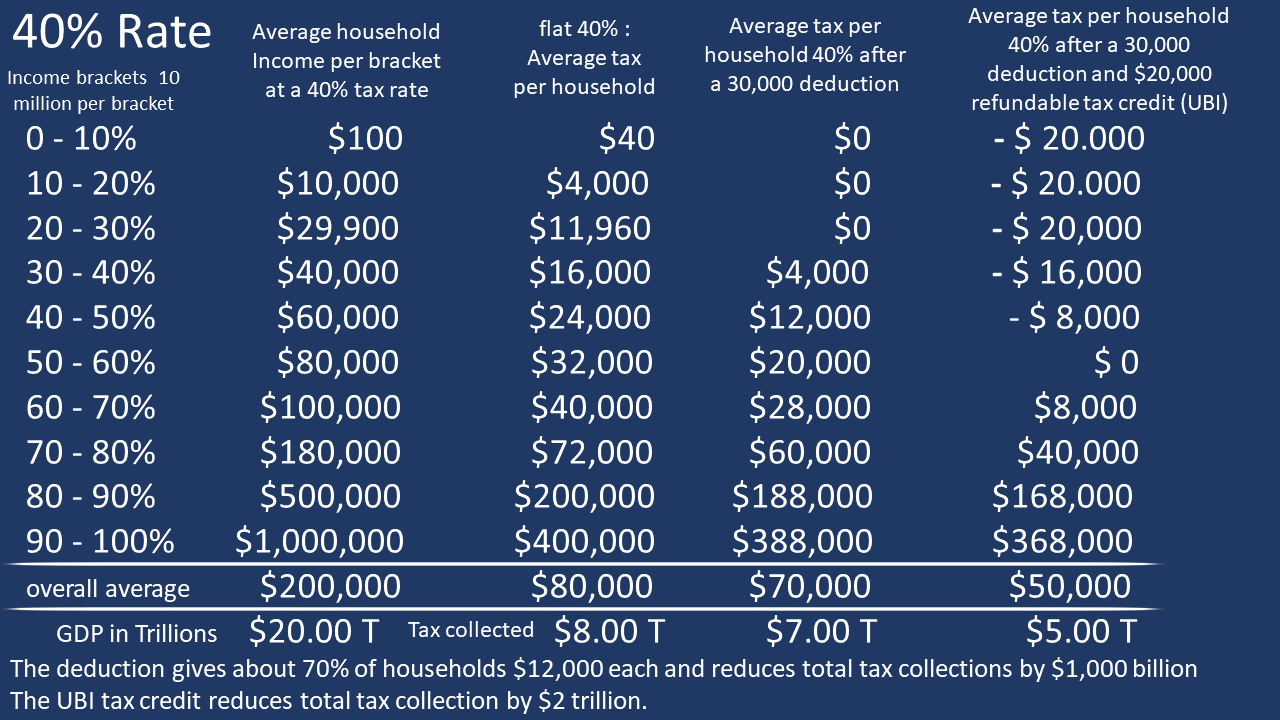
The flat tax achieves $8 trillion. The $30,000 deduction costs $1 trillion, and the tax credit costs $2 trillion, leaving $5 trillion for government services.
Note: government could have $0.33 T more tax revenue and a 33% higher average income with a 20% flat tax. |
|
Increasing tax rates from 40% to 50% losses an additional $3.33 trillion in GDP or $13.3 trillion from the 10% tax rate chart. The government does gain $0.33 trillion in additional tax revenue from the 40% flat tax chart and $5.3 trillion from the 10% chart. This is an absurd trade-off.
The flat tax achieves $8.3 trillion. The $30,000 deduction costs $1.21 trillion, and the tax credit costs $2 trillion, leaving $5.12 trillion for government services. Note: government could have $0.21 T more tax revenue and a 60% higher average income with a 20% flat tax. |

|
|
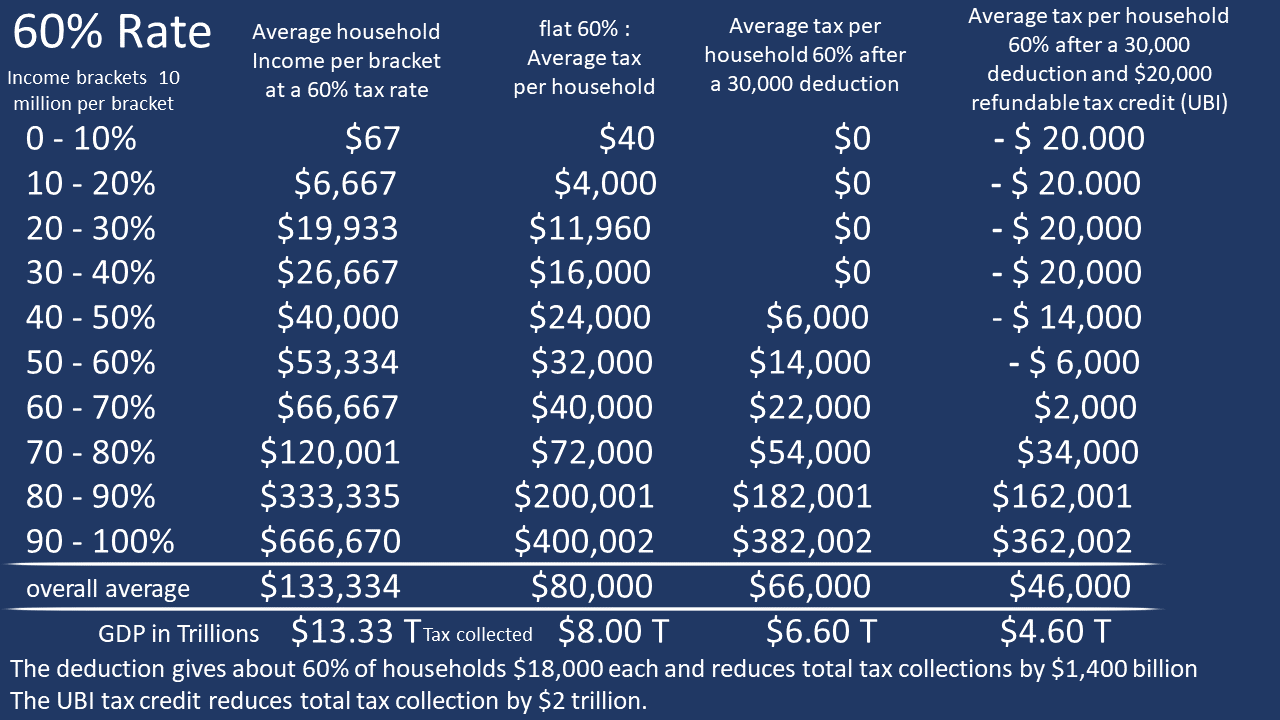
Increasing tax rates from 50% to 60% losses an additional $3.33 trillion in GDP from $16.67 T to $13.33 T. The government does NOT gain rather losses $0.33 trillion of tax revenue from the 50% flat tax. This is sliding down the bad side of the Laffer Curve with Zero upsides.
The flat tax achieves $8 trillion. The $30,000 deduction costs $1.4 trillion, and the tax credit costs $2 trillion, leaving $4.6 trillion for government services. Note: the government could have that same $4.6 Trillion with a flat tax rate of roughly 17%. Average income would be a little more than doubled, with the median household going from about $53 K to $110 K. |
|
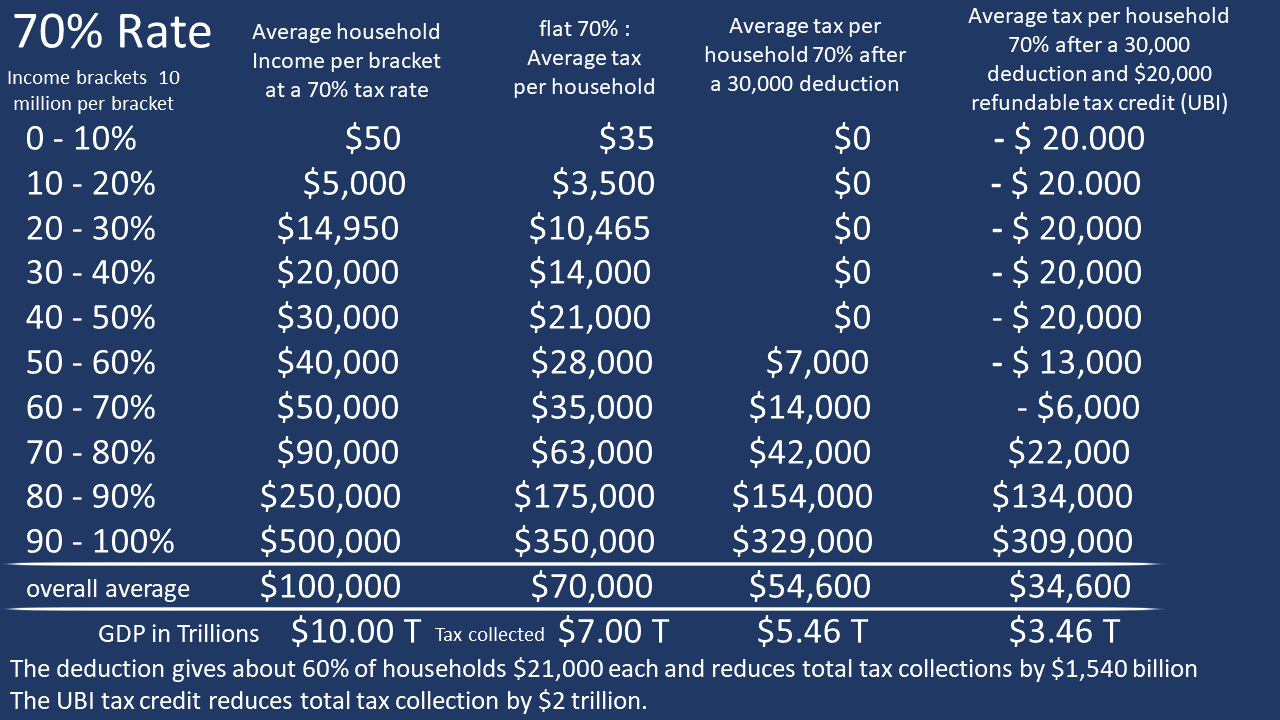
How many people will work past the basic necessities of life with a 70% tax rate? How many would-be great business owners will not work 80 hours a week to create jobs and produce goods and services just to have 70% taken by the government. Business owners will seek out friendlier business jurisdictions. Many will do without and enjoy more leisure hours. Others will risk tax evasion by doing under-the-table work. Everyone will consider creating their own garden and doing more do-it-yourself projects.
|
|
|
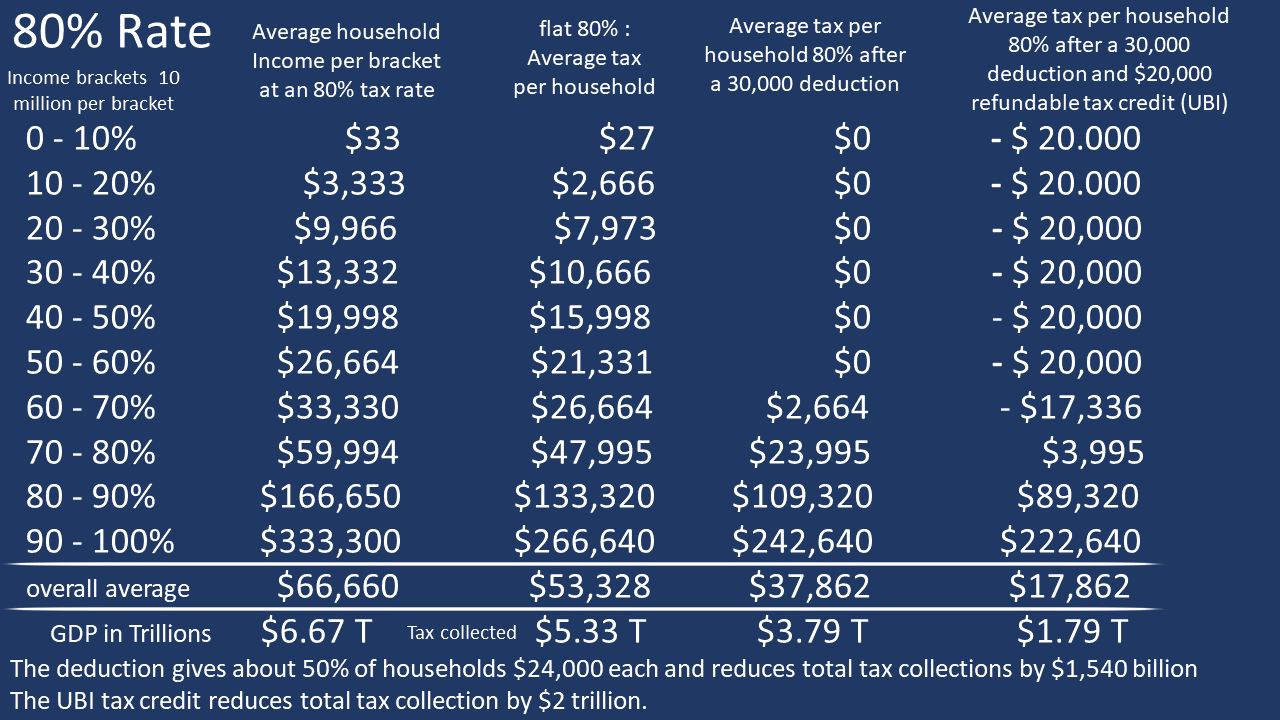
Before one claims that GDP will not get this low with 80% tax rates, I challenge everyone to draw a taxable GDP line where the line ends with zero taxable economic activity at 100% tax rates. The government might force or coerce people to work with punishments, reduced benefits, better work conditions, or a host of other non-income-related persuasions. The 13th Amendment will become relevant at these high tax rates.
At these rates, the government can not adequately fund the military or rule-of-law, much less take care of the poor or education. |
|
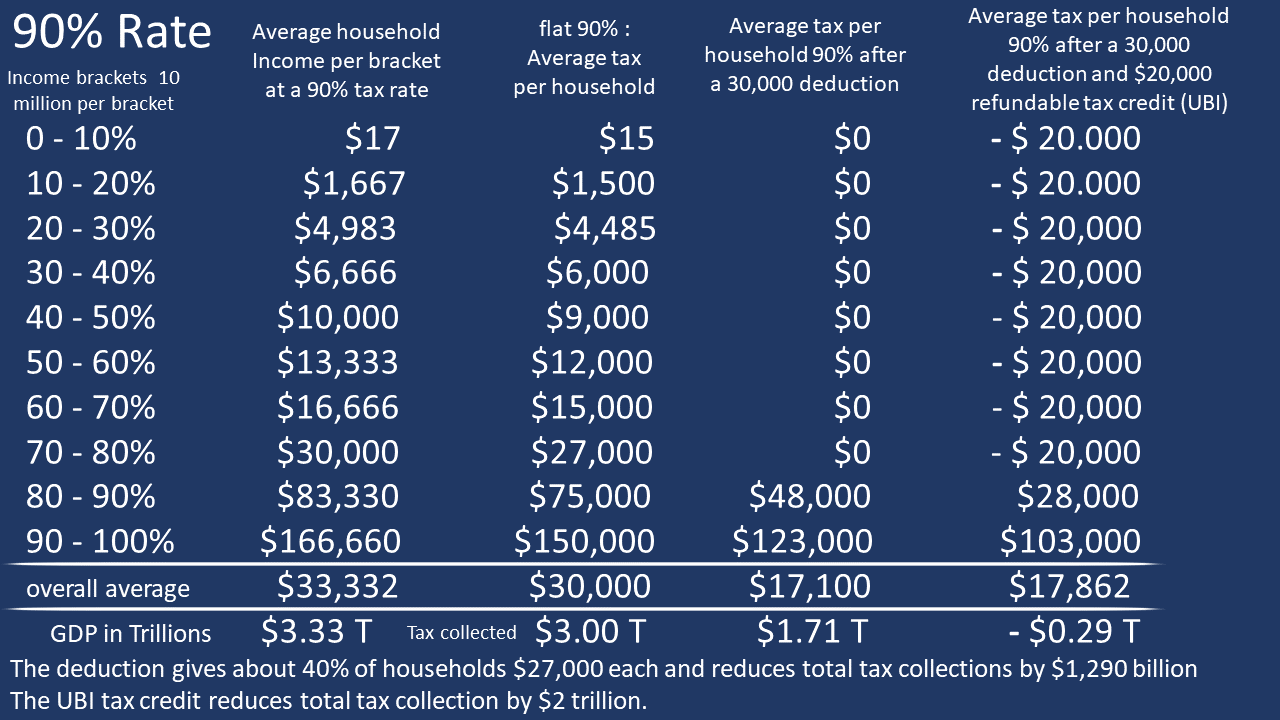
Many people will learn to get by with the $20,000 UBI style refundable tax credit, which will ruin their lives by taking away a significant portion of their self-esteem. The richest people will control everyone because they are funding them. The only way this works is with a flat tax which means someone earning at the 80% bracket would earn $83,330 and pay $75,000 in taxes, thus living on $8,330. This tax rate is a breeding ground for corruption and crime.
It is a good time to review these numbers with the other charts and ask, is this an economy in which you want to live. |
|
|
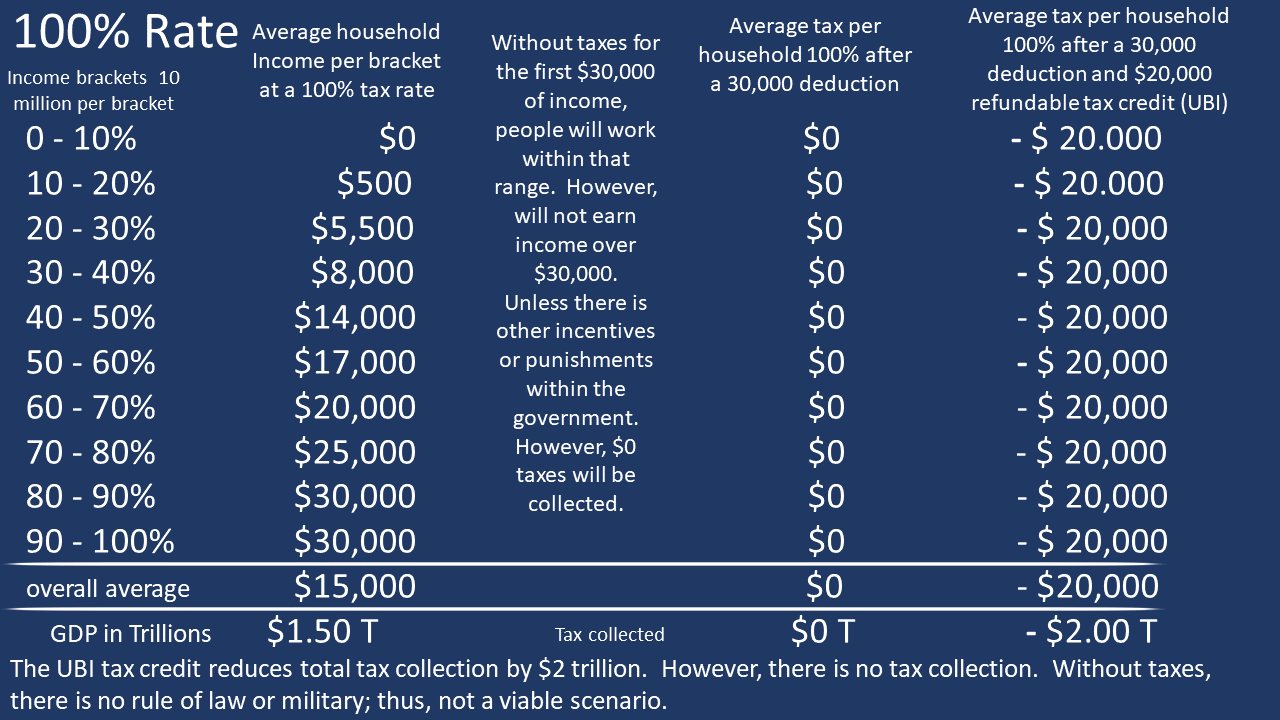
What would the economy look like if the government allowed everyone to earn up to $30,000 tax-free and impose a 100% tax rate for all income over $30,000? It is hard to determine, but the government would not have funds for government services because no one would earn more than $30,000. A UBI would not be possible unless we just monetize those funds and totally destroy the value of the currency, which is a significant tax. I speculated with numbers on the chart.
|