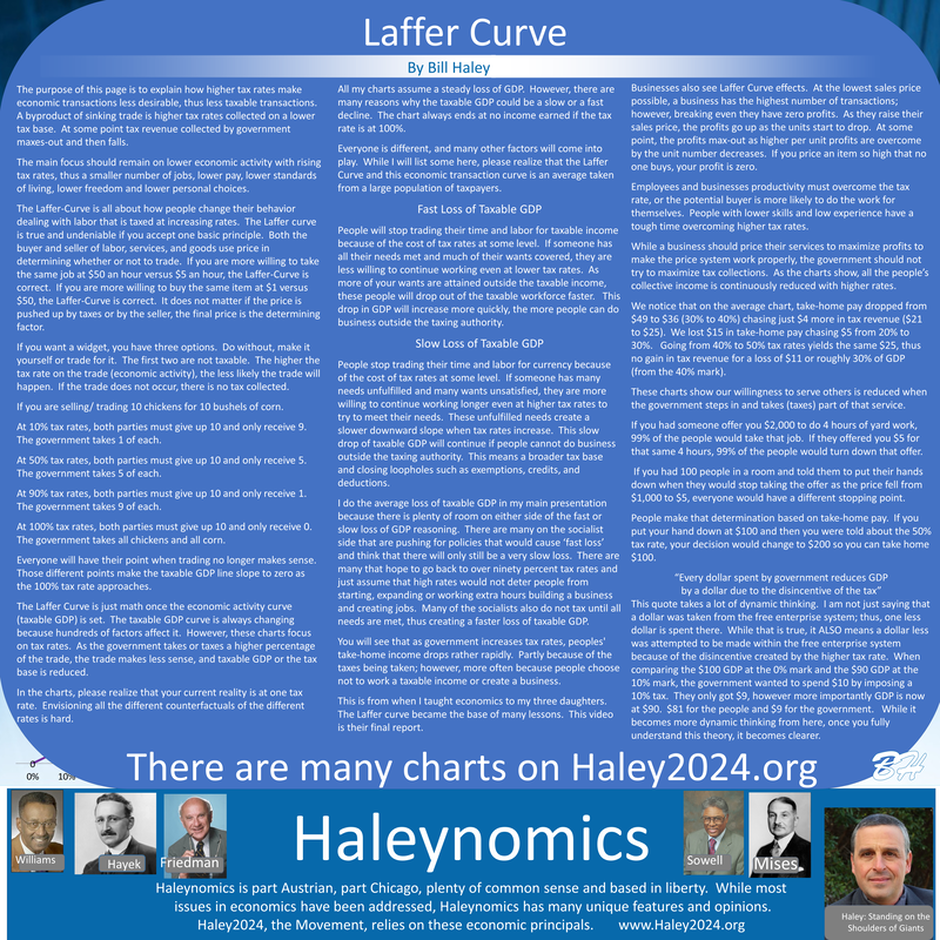
|
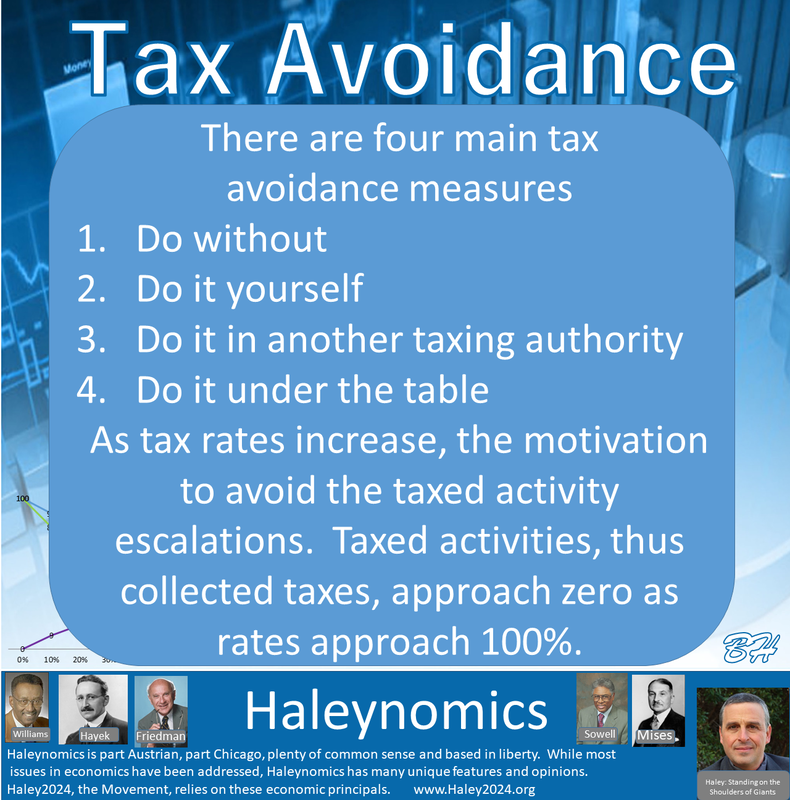
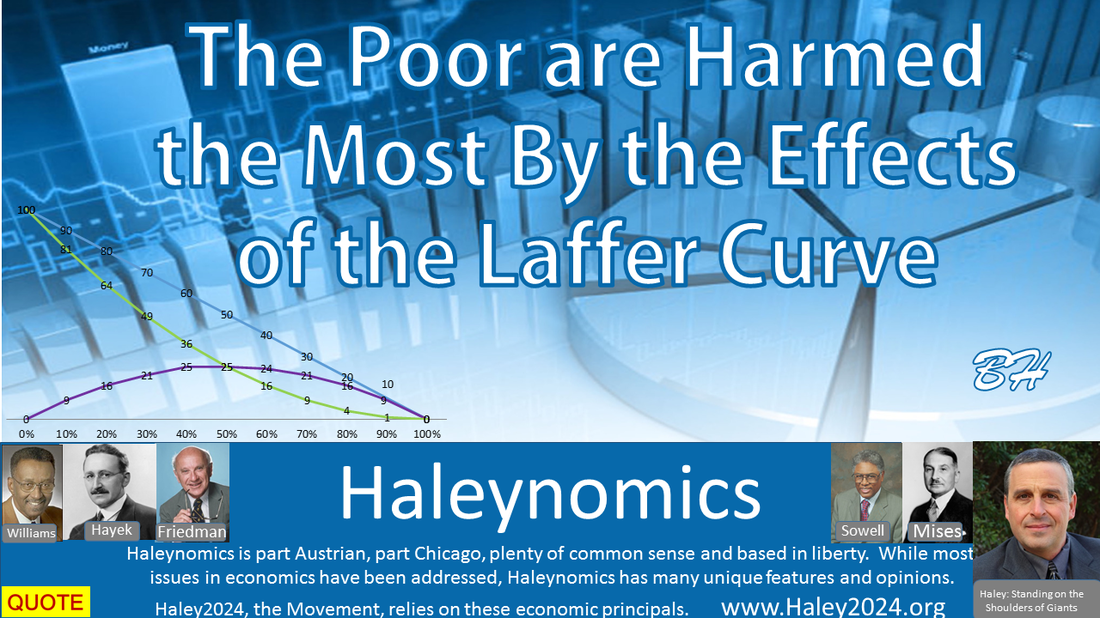
The Laffer-Curve is all about how people change their behavior dealing with labor that is taxed at increasing rates. The Laffer curve is true and undeniable if you accept one basic principle. Both the buyer and seller of labor, services, and goods use price in determining whether or not to trade. If you are more willing to take the same job at $50 an hour versus $5 an hour, the Laffer-Curve is correct. If you are more willing to buy the same item at $1 versus $50, the Laffer-Curve is correct. It does not matter if the price is pushed up by taxes or by the seller, the final price is the determining factor.
|
|
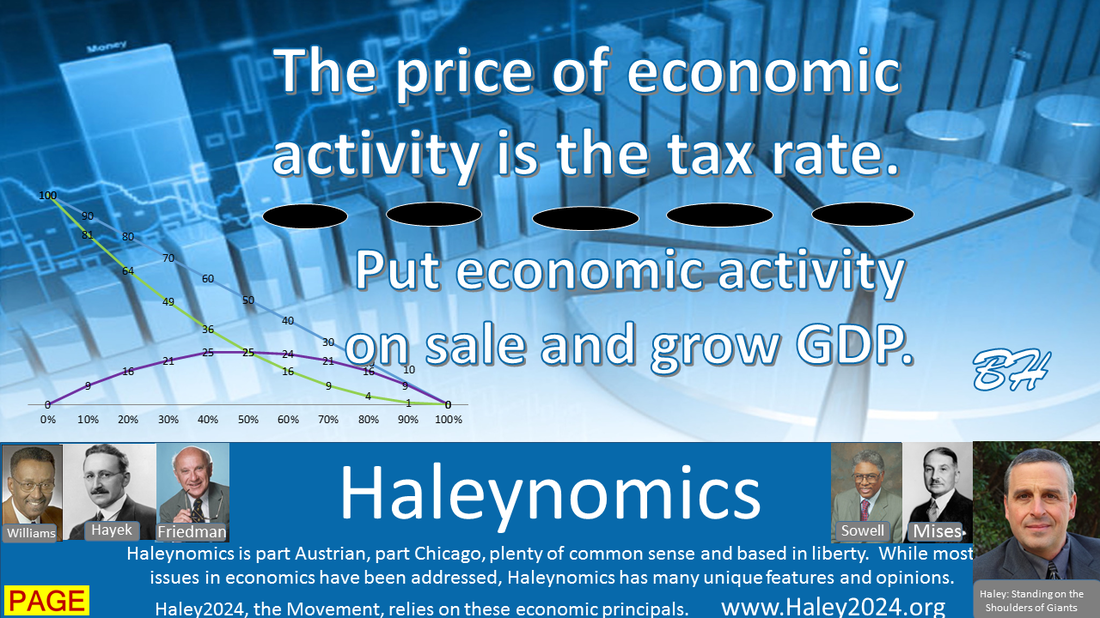
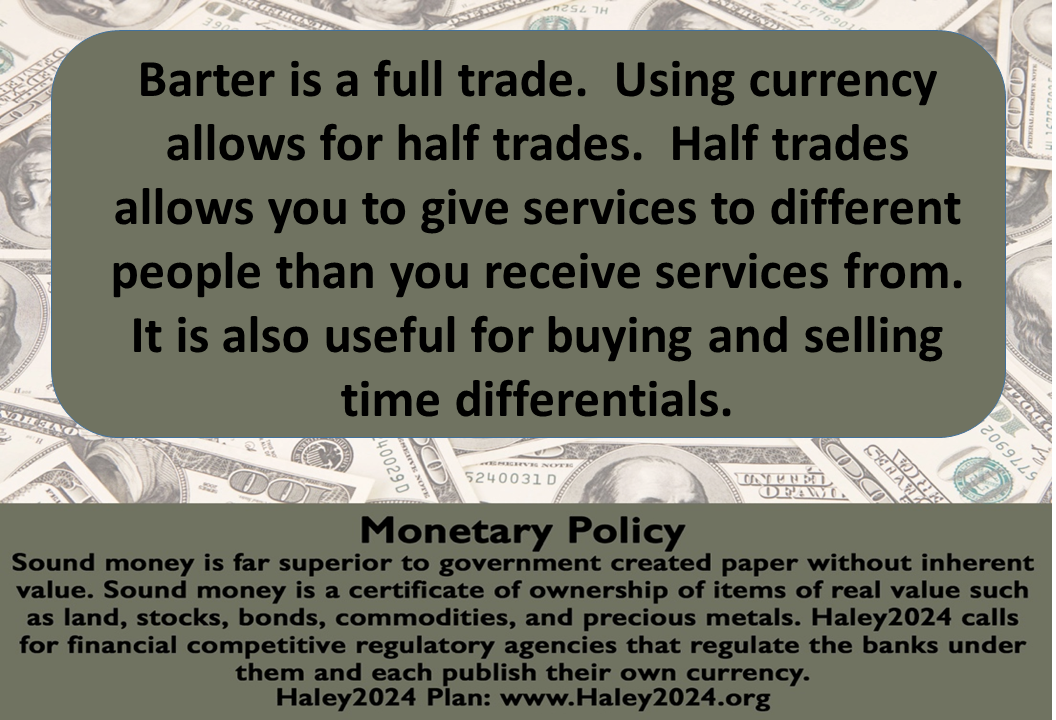
If you want a widget, you have three options. Do without, make it yourself or trade for it. The first two are not taxable. The higher the tax rate on the trade (economic activity), the less likely the trade will happen. If the trade does not occur, there is no tax collected.
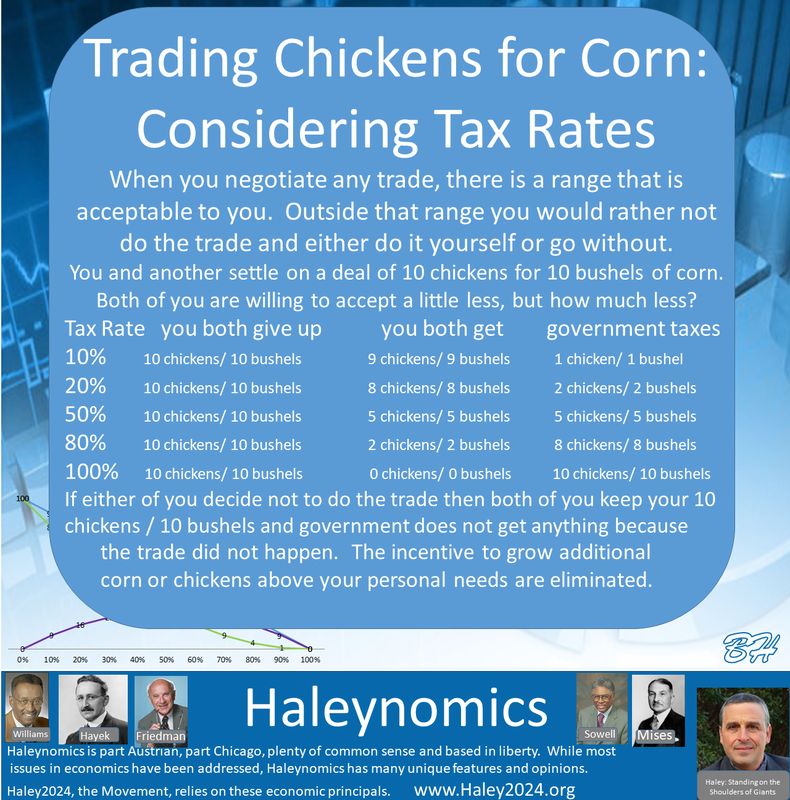
If you are selling/ trading 10 chickens for 10 bushels of corn. At 10% tax rates, both parties must give up 10 and only receive 9. The government takes 1 of each. At 50% tax rates, both parties must give up 10 and only receive 5. The government takes 5 of each. At 90% tax rates, both parties must give up 10 and only receive 1. The government takes 9 of each. At 100% tax rates, both parties must give up 10 and only receive 0. The government takes all chickens and all corn. Everyone will have their point when trading no longer makes sense. Those different points make the taxable GDP line slope to zero as the 100% tax rate approaches. |
|
|
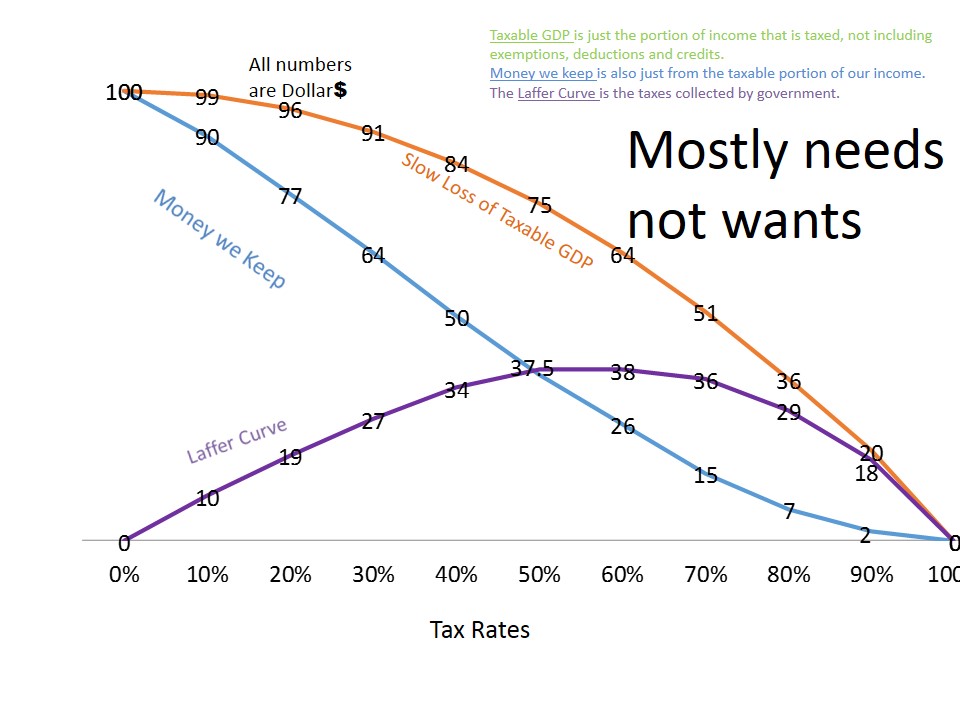
The Laffer Curve is just math once the economic activity curve (taxable GDP) is set. The taxable GDP curve is always changing because hundreds of factors affect it. However, these charts focus on tax rates. As the government takes or taxes a higher percentage of the trade, the trade makes less sense, and taxable GDP or the tax base is reduced.
In the charts, please realize that your current reality is at one tax rate. Envisioning all the different counterfactuals of the different rates is hard. |
|
All my charts assume a steady loss of GDP. However, there are many reasons why the taxable GDP could be a slow or a fast decline. The chart always ends at no income earned if the tax rate is at 100%.
Everyone is different, and many other factors will come into play. While I will list some here, please realize that the Laffer Curve and this economic transaction curve is an average taken from a large population of taxpayers. |

|

|
Fast Loss of Taxable GDP
People will stop trading their time and labor for taxable income because of the cost of tax rates at some level. If someone has all their needs met and much of their wants covered, they are less willing to continue working even at lower tax rates. As more of your wants are attained outside the taxable income, these people will drop out of the taxable workforce faster. This drop in GDP will increase more quickly, the more people can do business outside the taxing authority.
|
Slow Loss of Taxable GDP
People stop trading their time and labor for currency because of the cost of tax rates at some level. If someone has many needs unfulfilled and many wants unsatisfied, they are more willing to continue working longer even at higher tax rates to try to meet their needs. These unfulfilled needs create a slower downward slope when tax rates increase. This slow drop of taxable GDP will continue if people cannot do business outside the taxing authority. This means a broader tax base and closing loopholes such as exemptions, credits, and deductions.
|
|

|
I do the average loss of taxable GDP in my main presentation because there is plenty of room on either side of the fast or slow loss of GDP reasoning. There are many on the socialist side that are pushing for policies that would cause ‘fast loss’ and think that there will only still be a very slow loss. There are many that hope to go back to over ninety percent tax rates and just assume that high rates would not deter people from starting, expanding or working extra hours building a business and creating jobs. Many of the socialists also do not tax until all needs are met, thus creating a faster loss of taxable GDP.
|
|

|

|
You will see that as government increases tax rates, peoples' take-home income drops rather rapidly. Partly because of the taxes being taken; however, more often because people choose not to work a taxable income or create a business.
|
|
|
This is from when I taught economics to my three daughters. The Laffer curve became the base of many lessons. This is the final report.
|
|
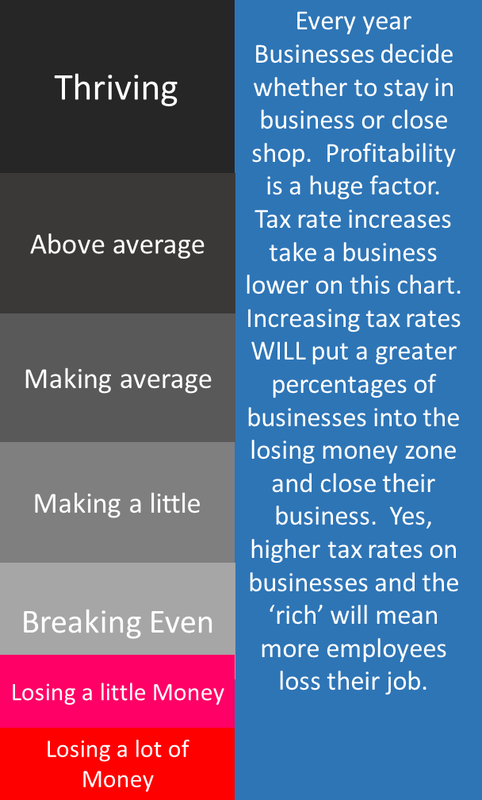
Businesses also see Laffer Curve effects. At the lowest sales price possible, a business has the highest number of transactions; however, breaking even they have zero profits. As they raise their sales price, the profits go up as the units start to drop. At some point, the profits max-out as higher per unit profits are overcome by the unit number decreases. If you price an item so high that no one buys, your profit is zero.
Employees and businesses productivity must overcome the tax rate, or the potential buyer is more likely to do the work for themselves. People with lower skills and low experience have a tough time overcoming higher tax rates. While a business should price their services to maximize profits to make the price system work properly, the government should not try to maximize tax collections. As the charts show, all the people’s collective income is continuously reduced with higher rates. We notice that on the average chart, take-home pay dropped from $49 to $36 (30% to 40%) chasing just $4 more in tax revenue ($21 to $25). We lost $15 in take-home pay chasing $5 from 20% to 30%. Going from 40% to 50% tax rates yields the same $25, thus no gain in tax revenue for a loss of $11 or roughly 30% of GDP (from the 40% mark). These charts show our willingness to serve others is reduced when the government steps in and takes (taxes) part of that service. |
|
|
If you had someone offer you $2,000 to do 4 hours of yard work, 99% of the people would take that job. If they offered you $5 for that same 4 hours, 99% of the people would turn down that offer.
If you had 100 people in a room and told them to put their hands down when they would stop taking the offer as the price fell from $1,000 to $5, everyone would have a different stopping point. People make that determination based on take-home pay. If you put your hand down at $100 and then you were told about the 50% tax rate, your decision would change to $200 so you can take home $100. |
|
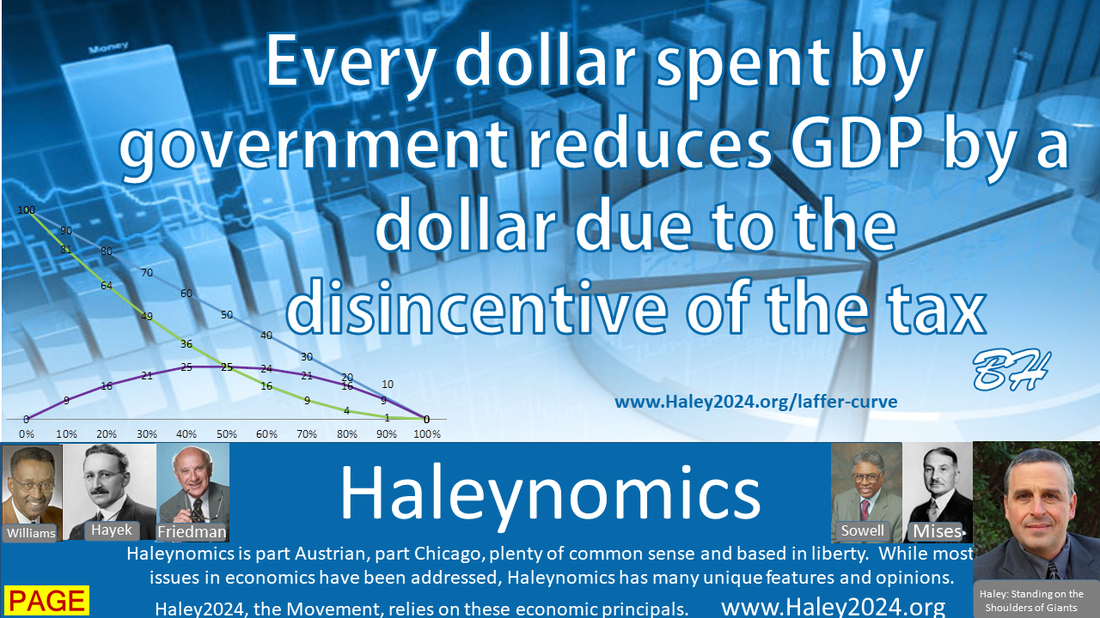
This quote takes a lot of dynamic thinking. I am not just saying that a dollar was taken from the free enterprise system; thus, one less dollar is spent there. While that is true, it ALSO means a dollar less was attempted to be made within the free enterprise system because of the disincentive created by the higher tax rate. When comparing the $100 GDP at the 0% mark and the $90 GDP at the 10% mark, the government wanted to spend $10 by imposing a 10% tax. They only got $9, however more importantly GDP is now at $90. $81 for the people and $9 for the government. While it becomes more dynamic thinking from here, once you fully understand this theory, it becomes clearer.
|
|