| There are many variations of the Universal Basic Income (UBI); however, the basic notion is that it is a government welfare program that adds to or replaces some current welfare programs. One striking point is that it gives to everyone in the effort to rid the current system of the problems relating to means-tested benefits. Most proposals add tax money to the system, so the same dollar figure is not spread thinly over all the people versus being concentrated on the poor. | 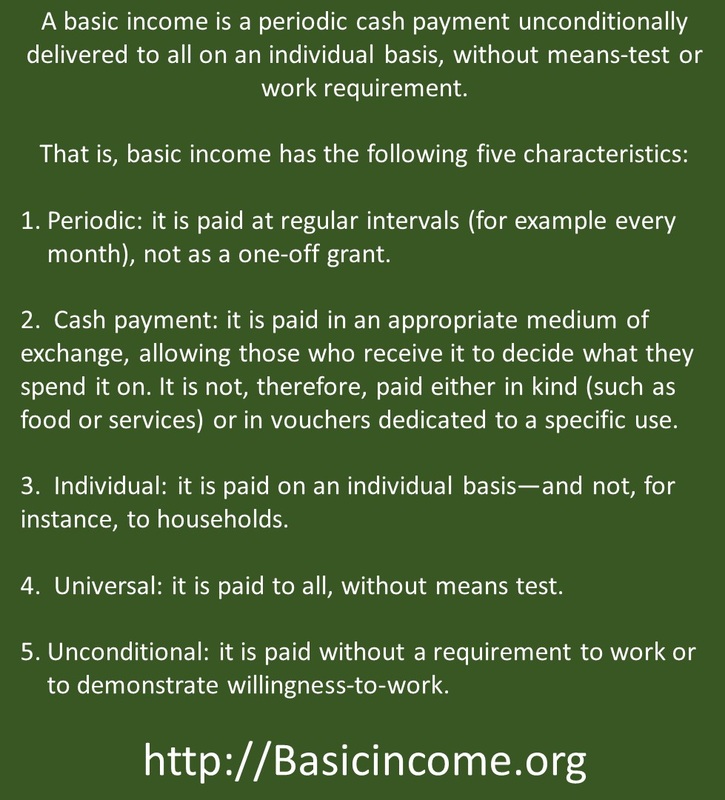 |
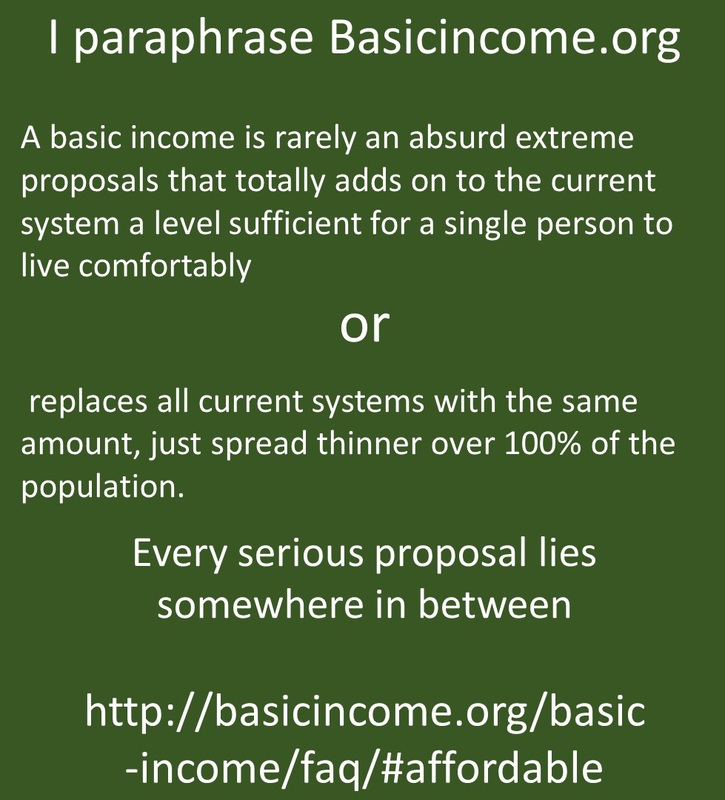 | Seldom do the UBI proponents talk about where the extra taxes are being acquired. They are not silent on the issue; however, most do not address the tax rate increases needed to achieve the necessary funds. Many people concentrate on ending basic welfare cash payments, food stamps, housing allowance, among others, and transferring the money to the UBI. The current system focuses those benefits on a small percentage of the population 10%-30%. The government would need to increase tax revenue significantly to keep the same amount per person and bring that percentage to 100% of the people. |
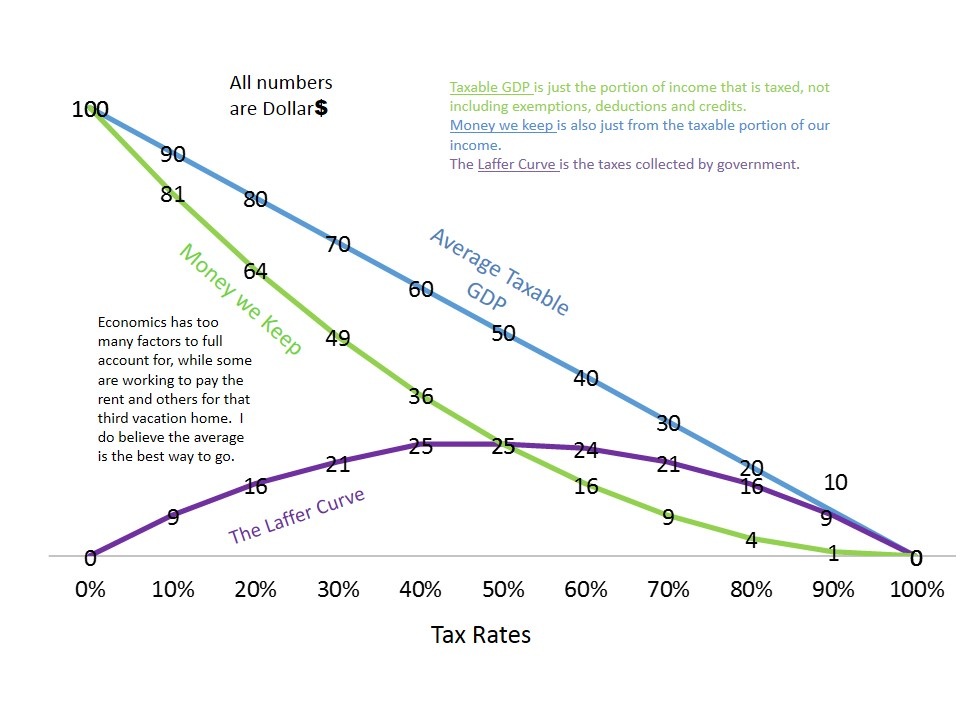
| The basic notion of the Laffer curve is that as tax rates increase, people’s willingness to work the next hour is reduced. The big point is economic activity is reduced when people choose not to work those extra hours, thus higher tax rates create disincentives from serving your fellow man. The Laffer Curve is demonstrated by the tax revenue not received by hours not worked. Whether it is a faster loss of GDP, a steady loss or a quick loss, the end result is that taxable GDP needs to drop to zero as the tax rate reaches 100%. It is an economic truth that as tax rates go up, taxable GDP goes down. The Laffer Curve just tries to graph it out dealing with how the taxable GDP slopes down to $0. |  |
 | Marginal tax rates from means-tested welfare mean that welfare benefits are reduced as you earn money. This says if you increase your earnings, you lose benefits; thus, your work brings in the difference between increased earnings and the value of the benefit loss. Taking the high marginal tax rates away from those with lower incomes by eliminating means-tested welfare will be an increase in work from those with lower incomes. Ending means-tested welfare is a positive idea. |
| It is hard to demonstrate or comprehend how powerful ending that destructive idea will be. However, the UBI is not the only way to eliminate means testing. The UBI replaces a bad system with another inferior policy. Government giving money to everyone means that the government needs to tax everyone to acquire that money. The major disincentive of doing an activity that is taxed, is the reduced overall economic activity, thus doing significant harm. | 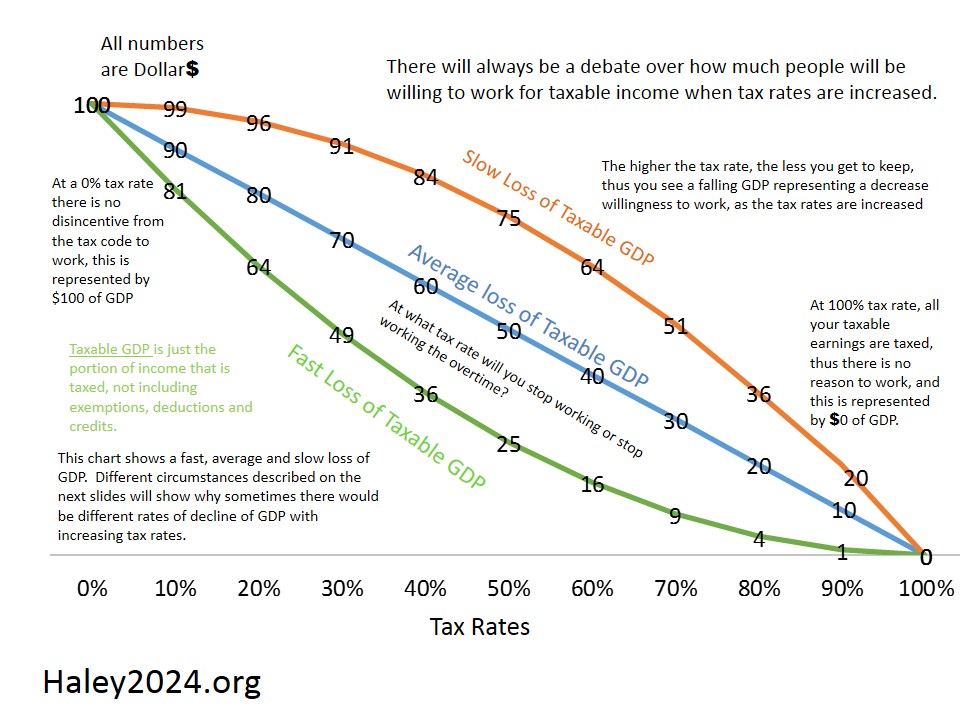 |
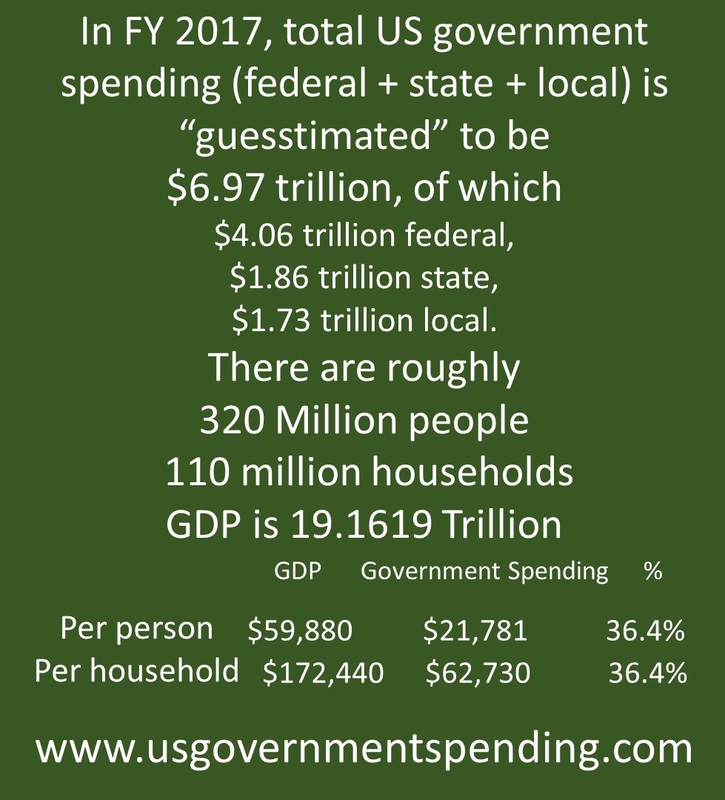
 | Universal Basic Income and the Laffer Curve Most serious UBI plans put the price tag at about $2 Trillion, which is about $10,000 per adult and exclude those on Social Security. While some money might be diverted from other welfare programs, I will use the full $2 trillion because all government spending raises tax rates. That is 10.4% of GDP. |
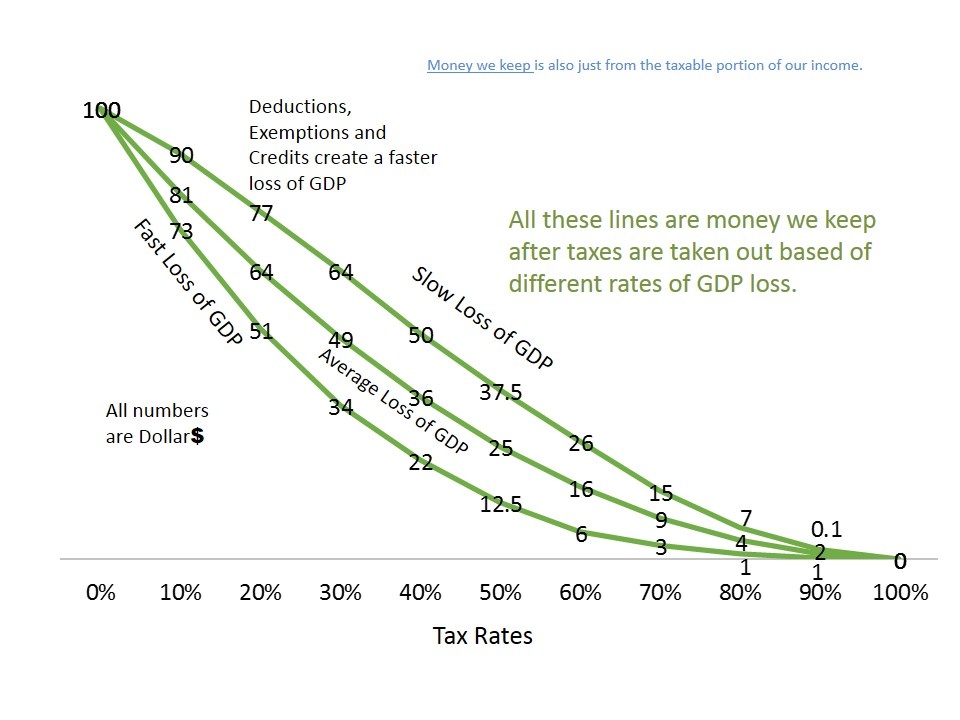
| I will use 19.1619 trillion GDP (mid-2017) at the current 36.4% government spending to GDP. Government spending going from 30% to 40% (factoring in about 60% welfare replacement) on my slow, average and fast loss of taxable GDP chart, shows that taxable GDP drops 7.7%, 14.3%, or 26.5% respectfully, because of the increased tax rates going up from 30% to 40%. | 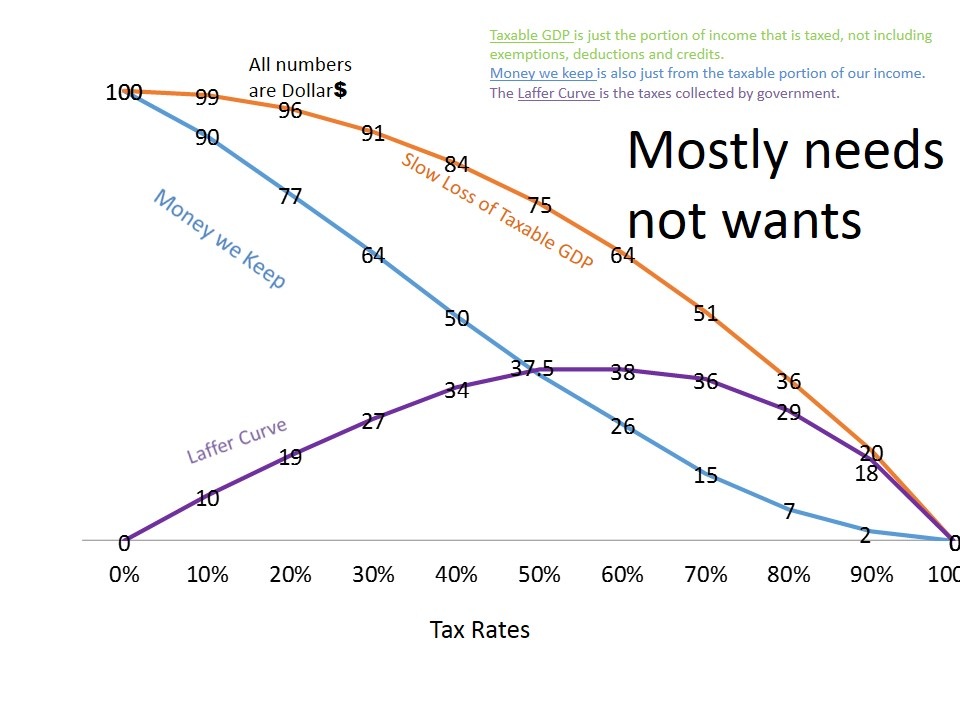 |
 | These numbers come with dozens of asterisks because all the changes occur with human reactions to the change. Government spending at 30% of GDP (meaning without the UBI or some of the current programs) would likely yield a GDP between $20.04 trillion to 22.2 trillion. This increase would not be overnight but would be demonstrated by higher economic growth rates over several years. |
| Government spending at 40% of GDP would likely yield a GDP between $17.15 trillion to 18.4 trillion. This decrease would not be overnight but would be demonstrated by lower economic growth rates over several years and massive inflation. The government must lose about $1.5 to $5 trillion of GDP to tax the $2 trillion for the UBI. | 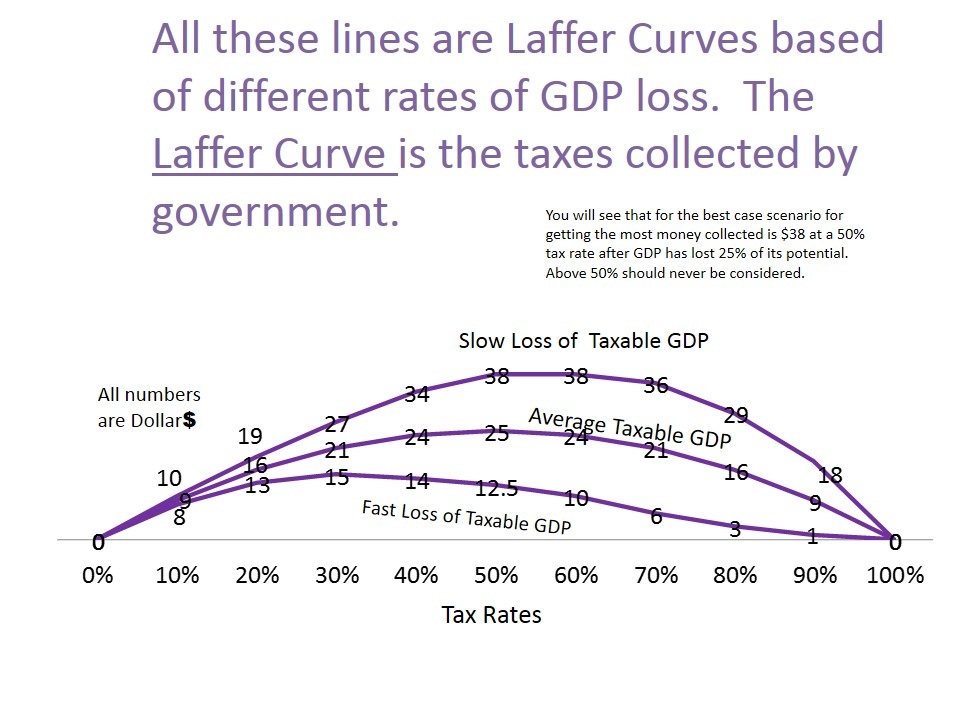 |
 | An important factor with the Laffer Curve is that when taxable GDP drops, the tax rate needs to chase the rates up creating even higher GDP losses and again higher rates. While the slow decline of GDP chart will likely stop at about 45%, the faster decline of GDP chart is likely to go over the edge and down the bad side of the Laffer Curve, which means there is no reaching the amount needed. |
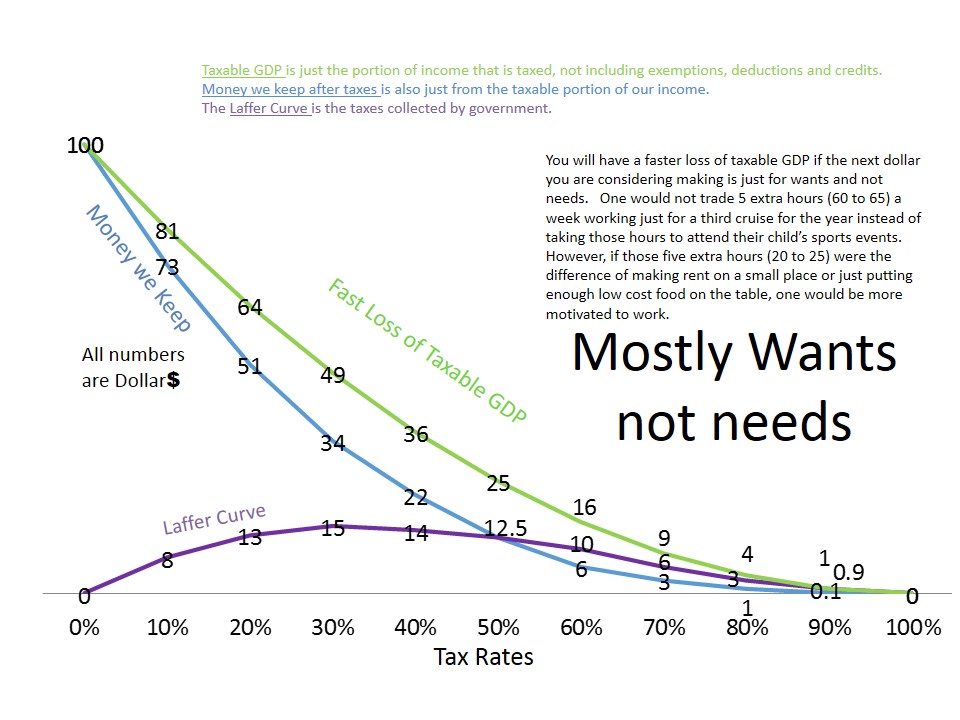
| People will stay working even at higher tax rates if they really need to feed their families. However, after needs are met and the choice of work is just to achieve wants, the higher tax rates will result in more people picking greater leisure hours over the next hour of work. That yields less money because it results in lower taxable labor hours. The UBI's purpose is to take care of needs; thus, the more generous the UBI is, the more the Laffer Curve moves towards, the faster-loss of GDP chart. The elimination of means testing which lowers marginal tax rates for the poor is a help; however, the UBI is not the only way to end means testing. |  |
 | Just to be clear, any changes of this magnitude will result in massive changes in the behavior of everyone that is difficult to predict. When doing the math, I used basic tax rates without additional or reduced exemptions, deductions or credits. |